Who It's Best For
Sunnyland is where first-time buyers should be looking if they've been getting outbid or priced out of other central Bellingham neighborhoods. It's accessible, it's central, it's appreciating, and it has more character than people give it credit for. Young professionals and artists have been discovering it for the same reasons. Families on a tight budget find good parks and solid school access. Investors pay attention here too — central location plus accessible prices plus strong rental demand is a combination that tends to work out.
The Real Estate Market
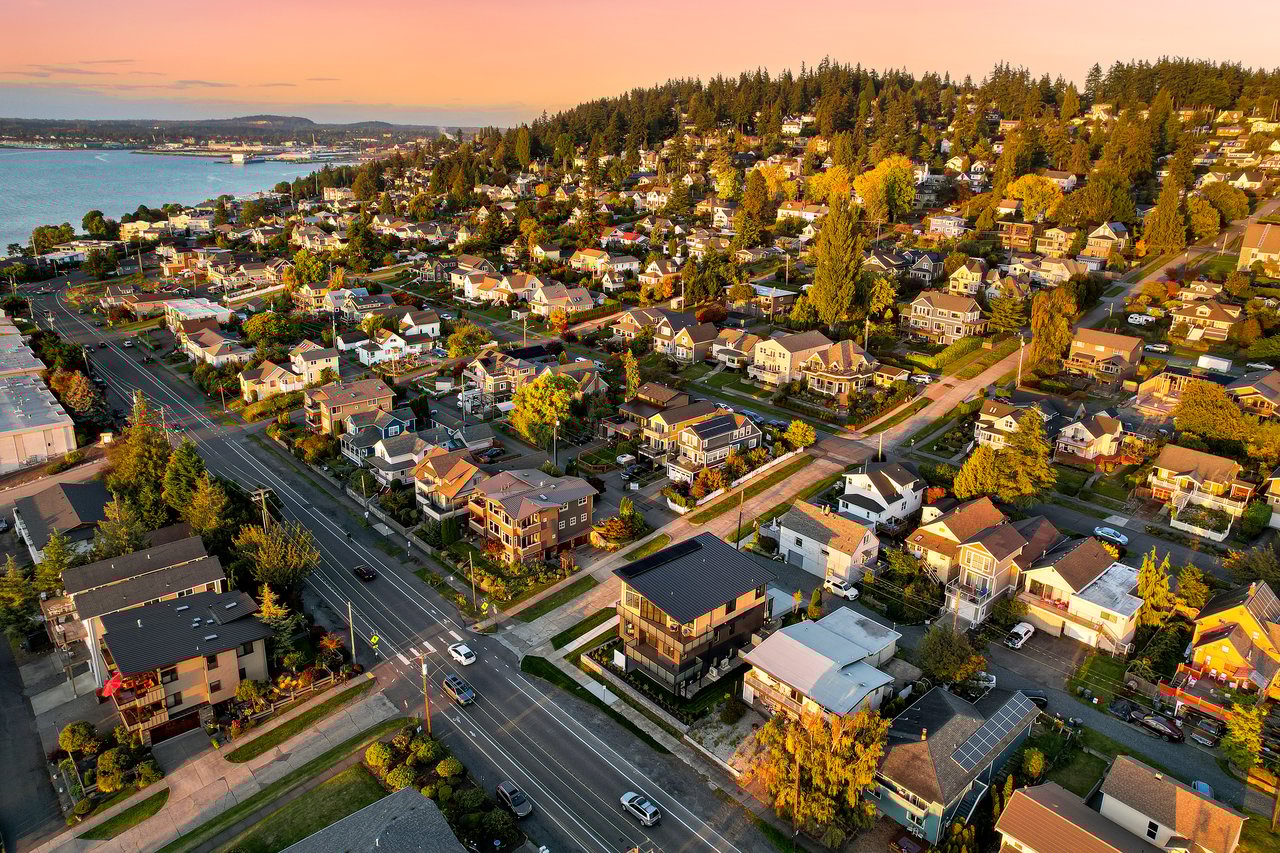
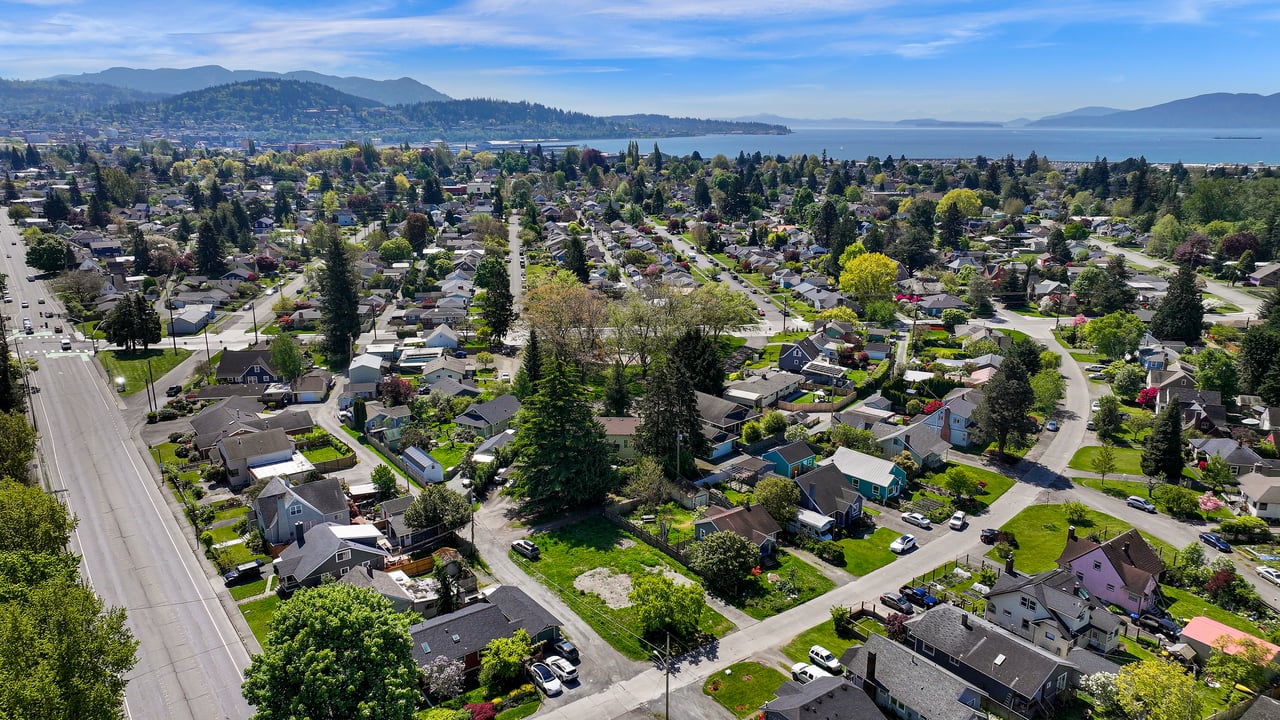
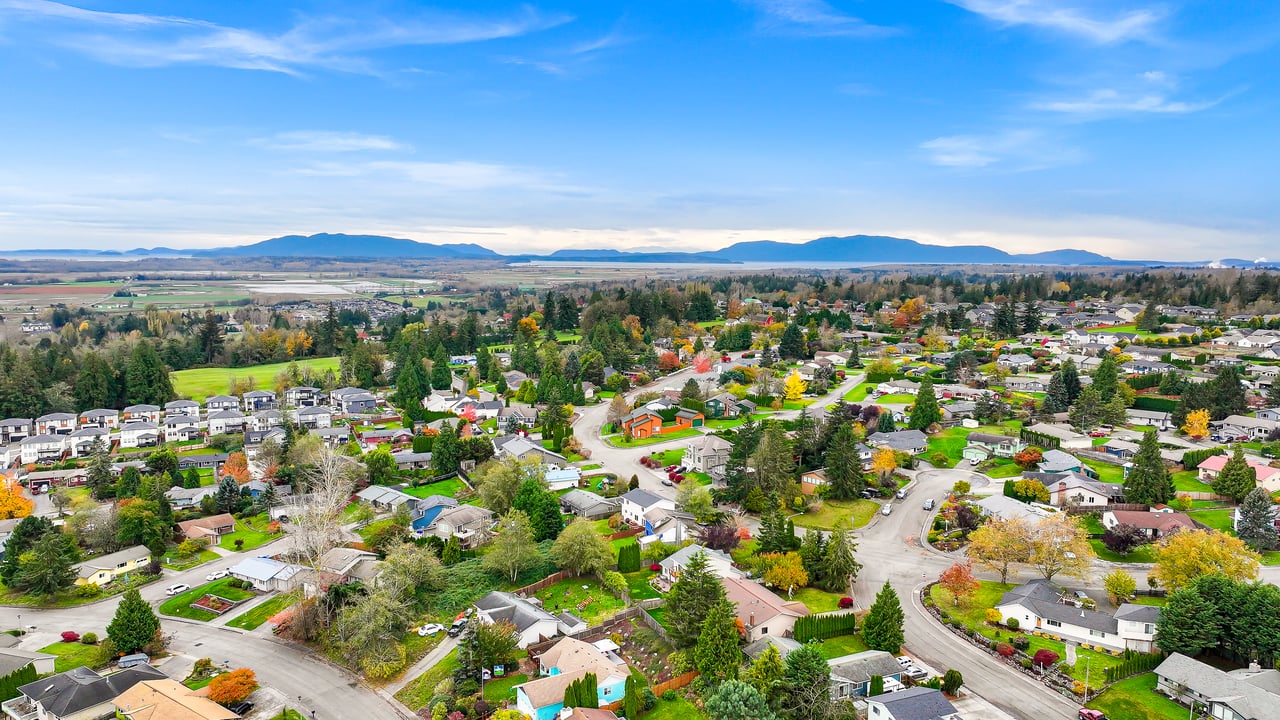
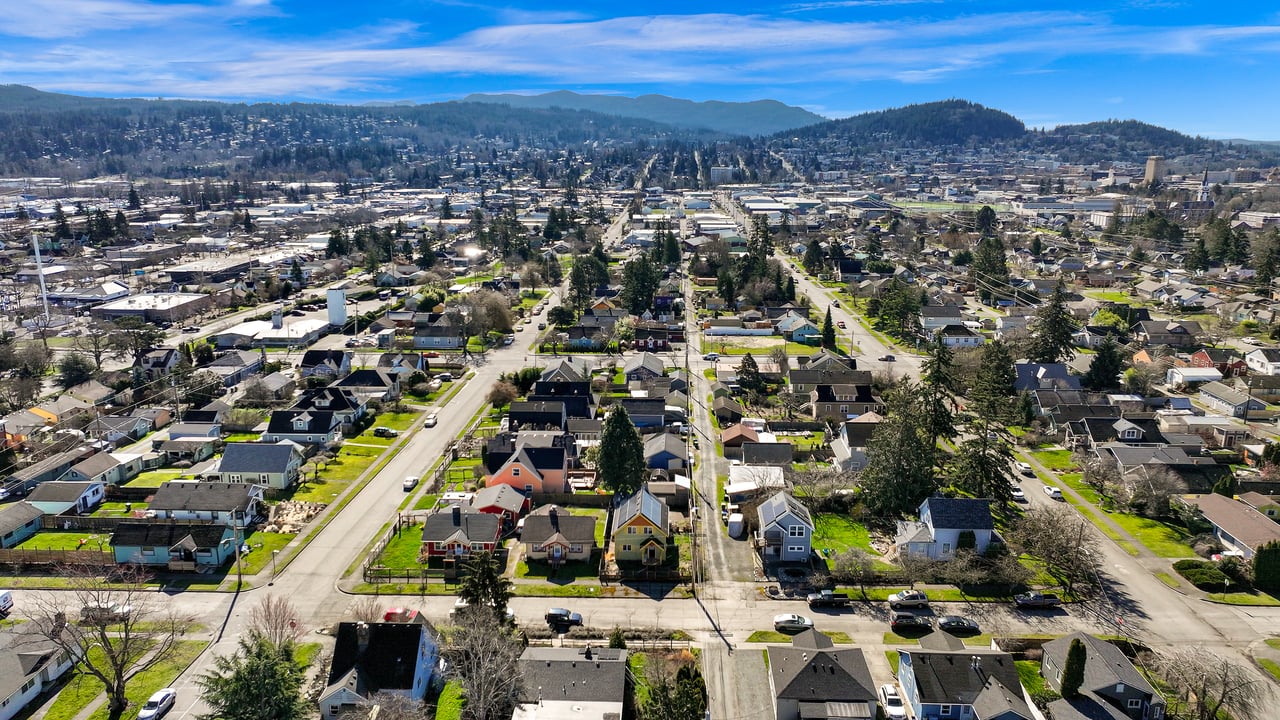
The housing here is a mix of smaller, older homes — a lot of mid-20th century stock — alongside rentals, duplexes, and a growing number of multi-family developments as the neighborhood continues to evolve. Prices are among the most accessible in central Bellingham, typically $400K to $600K for single-family homes, with condition and proximity to amenities doing most of the work on pricing within that range. Sunnyland is in the middle of a gradual revitalization that's been good for values and for the neighborhood's energy.
Nearby Amenities
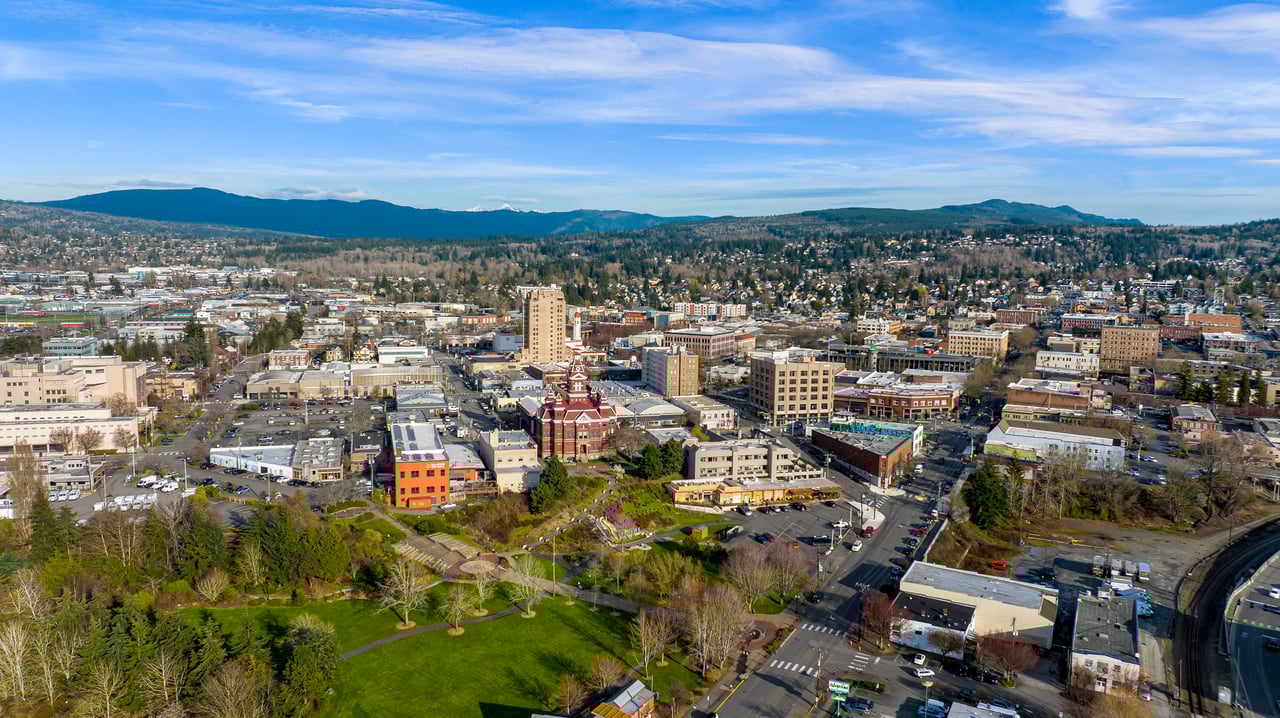
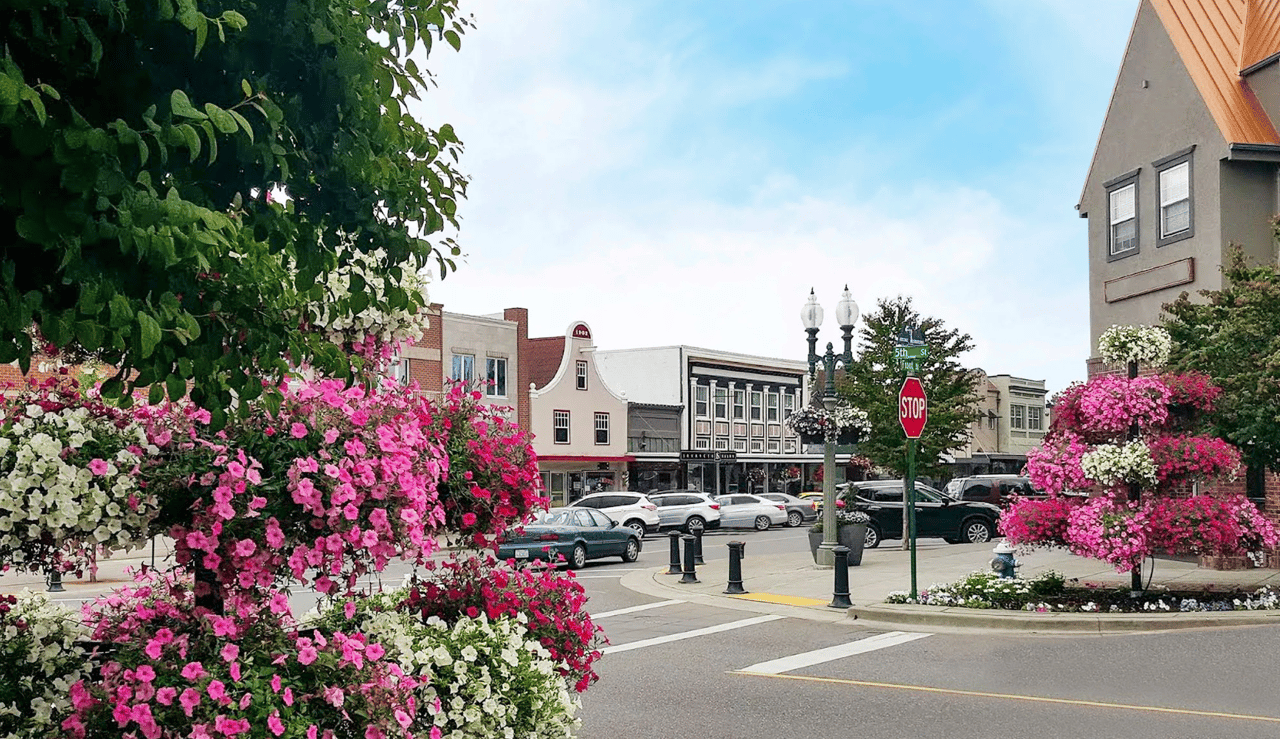
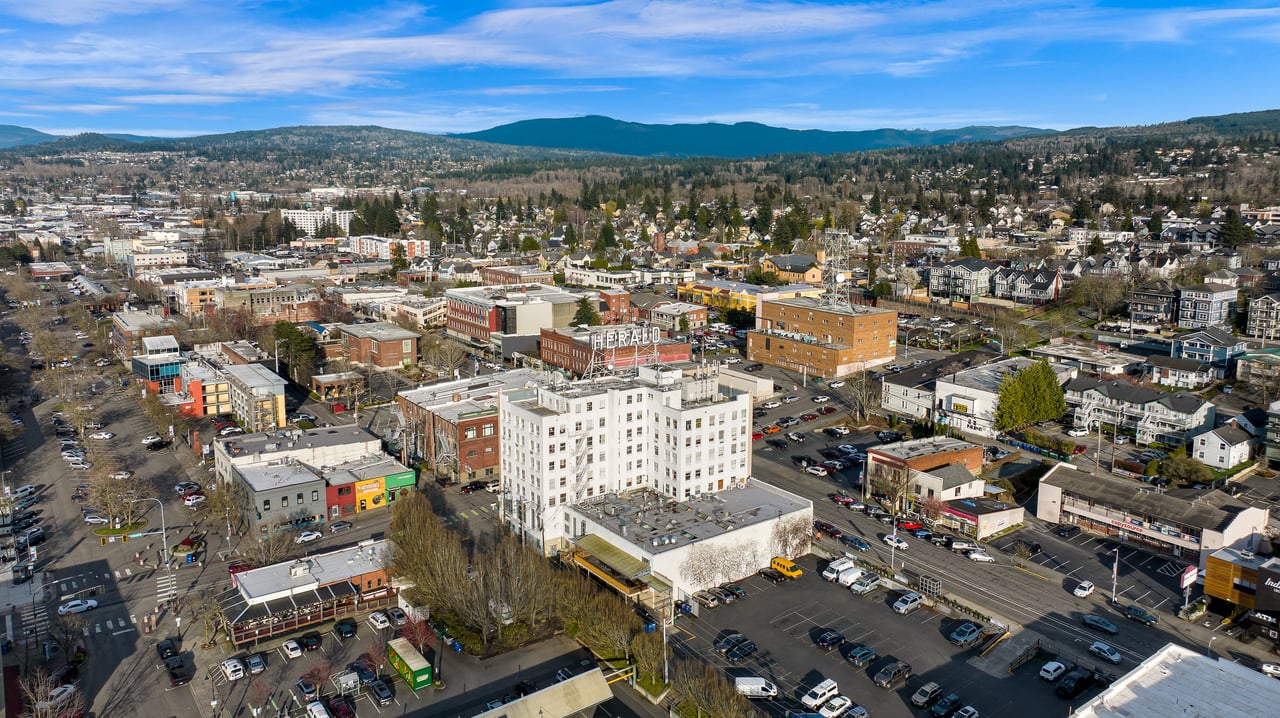
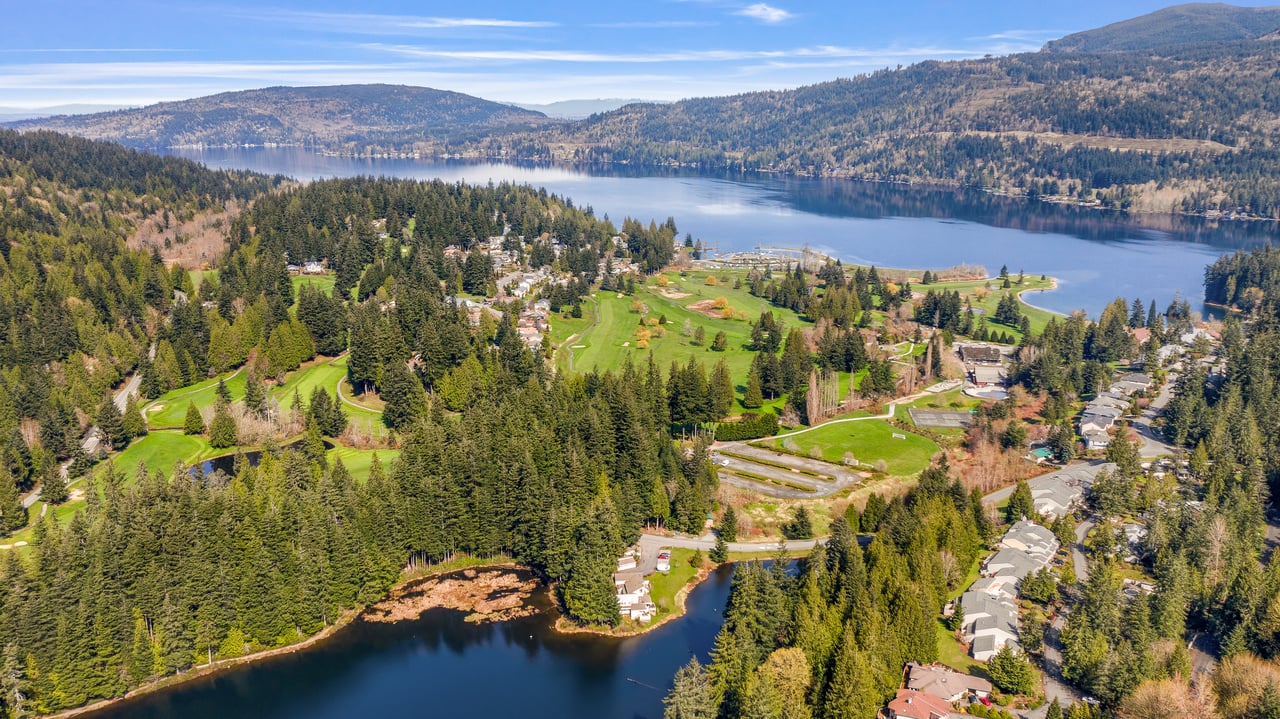
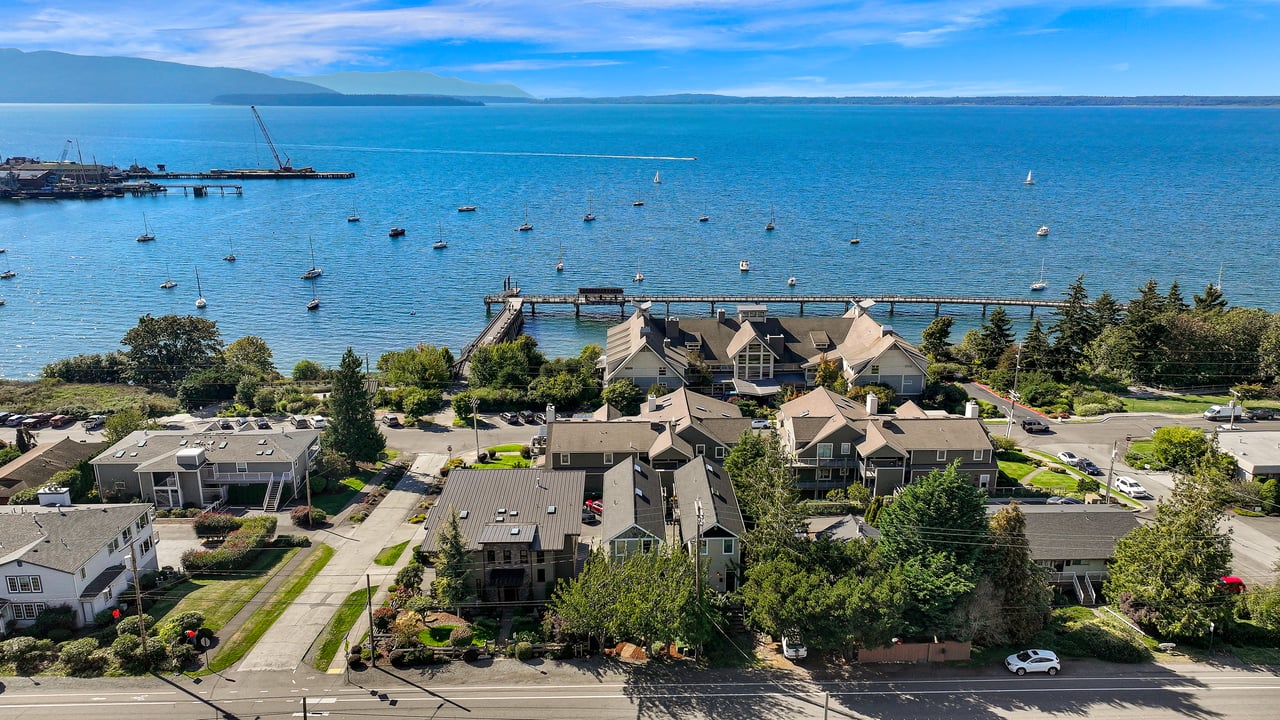
Memorial Park and Sunnyland Park both offer playgrounds, open lawns, and community gathering space. James Street is the neighborhood's commercial spine with local restaurants, coffee, and the growing craft beverage scene. Sunnyland Elementary is walkable from most of the neighborhood. Strong transit connections and excellent bike lanes. Barkley Village is just to the north for broader shopping and dining. Downtown Bellingham is a short bike ride or drive away.
Sunnyland has 994 households, with an average household size of 2. Data provided by the U.S. Census Bureau. Here’s what the people living in Sunnyland do for work — and how long it takes them to get there. Data provided by the U.S. Census Bureau. 2,521 people call Sunnyland home. The population density is 5,520 and the largest age group is Data provided by the U.S. Census Bureau.
Total Population
Population Density Population Density This is the number of people per square mile in a neighborhood.
Median Age
Men vs Women
Population by Age Group
0-9 Years
10-17 Years
18-24 Years
25-64 Years
65-74 Years
75+ Years
Education Level
Total Households
Average Household Size
Average individual Income
Households with Children
With Children:
Without Children:
Marital Status
Blue vs White Collar Workers
Blue Collar:
White Collar: